Go pprof for detecting wasted Goroutines
I. Setup pprof
Step 1: Setup the server
Despite what kind of your Golang app is, add those lines of code to the
main.go file:
// Add this
import _ "net/http/pprof"


func main() {

    // Add this to run pprof server
    go func() {
        fmt.Println(http.ListenAndServe("localhost:9999", nil))
    }()

    // The rest is your normal code...
}
Step 2: Visualize the data
# Install Google pprof visual tool
go get -u github.com/google/pprof

# Visualize CPU profile for 5 seconds
pprof -http :9998 'http://:9999/debug/pprof/profile?seconds=5'
pprof command will open an interactive web at http://localhost:9998 for
you to poke around.
II. Look at the graph
When doing nothing, our app results in this graph (part of it):
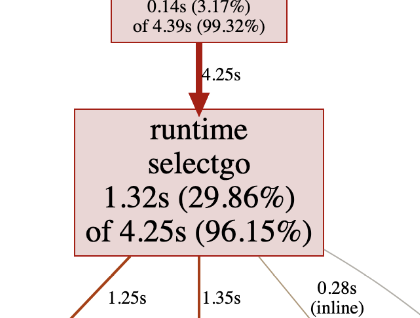
Now something must be wrong with one of our for-select code because we
are paying CPU time for the app to do nothing. Turn out it was a
default: continue bug in a for-select block.
After the fix, we get:
[blank]
Yes, we got nothing, because when idling the app shouldn’t do anything, hence must consume nothing.